Introduction
New Relic is a powerful application performance management (APM) tool that helps developers monitor and optimize their web applications. One of the key features of New Relic is Synthetics Monitoring, which allows you to monitor the performance and availability of your website using scripted browser tests. In this article, we will walk you through the process of setting up Synthetics Monitoring in New Relic, so you can ensure your web applications are running smoothly and efficiently.
Step 1: Sign Up for New Relic
To get started with Synthetics Monitoring, you need to have a New Relic account. If you don’t have one already, visit the New Relic website and sign up for a free trial or a paid account, depending on your needs.
Step 2: Access Synthetics in New Relic
After you have signed up and logged into your New Relic account, click on the “Synthetics” tab in the left-hand menu. This will take you to the main Synthetics dashboard.
Step 3: Create a New Monitor
To create a new Synthetics Monitor, click on the “Create Monitor” button in the top right corner of the Synthetics dashboard. This will open a new window where you can configure your monitor.
Step 4: Choose the Monitor Type
New Relic offers several types of Synthetics Monitors, including:
- Ping: A simple uptime check that verifies if your website is accessible.
- Simple Browser: A basic test that loads a specific URL in a real browser and measures its performance.
- Scripted Browser: A more advanced test that allows you to interact with your website using custom scripts.
- API Test: A test designed to monitor the performance of your API endpoints.
Choose the monitor type that best fits your needs and proceed to the next step.
Step 5: Configure Your Monitor
Once you have chosen the monitor type, you need to configure the monitor settings. This will vary depending on the type of monitor you selected. Here are some common configuration options:
- Monitor Name: Give your monitor a descriptive name so you can easily identify it later.
- URL: Enter the URL of your website or API endpoint you want to monitor.
- Check Frequency: Choose how often you want the monitor to run, from every minute to once per day.
- Locations: Select the geographic locations from which the monitor will run. It’s a good idea to choose multiple locations to get a more accurate picture of your website’s performance.
For Scripted Browser and API Test monitors, you will also need to provide a custom script. New Relic offers a variety of scripting templates to help you get started, or you can write your own script using JavaScript.
Step 6: Verify Your Monitor
Once you have configured your monitor, click the “Validate” button to test it. New Relic will run the monitor and display the results. If everything is set up correctly, you should see a green “Monitor is valid” message. If there are any errors, review your configuration and make any necessary changes.
Step 7: Save and Activate Your Monitor
After you have verified your monitor, click the “Save” button to save it. Your new monitor will now be active and will start collecting data based on your selected check frequency.
Step 8: Analyze Monitor Results
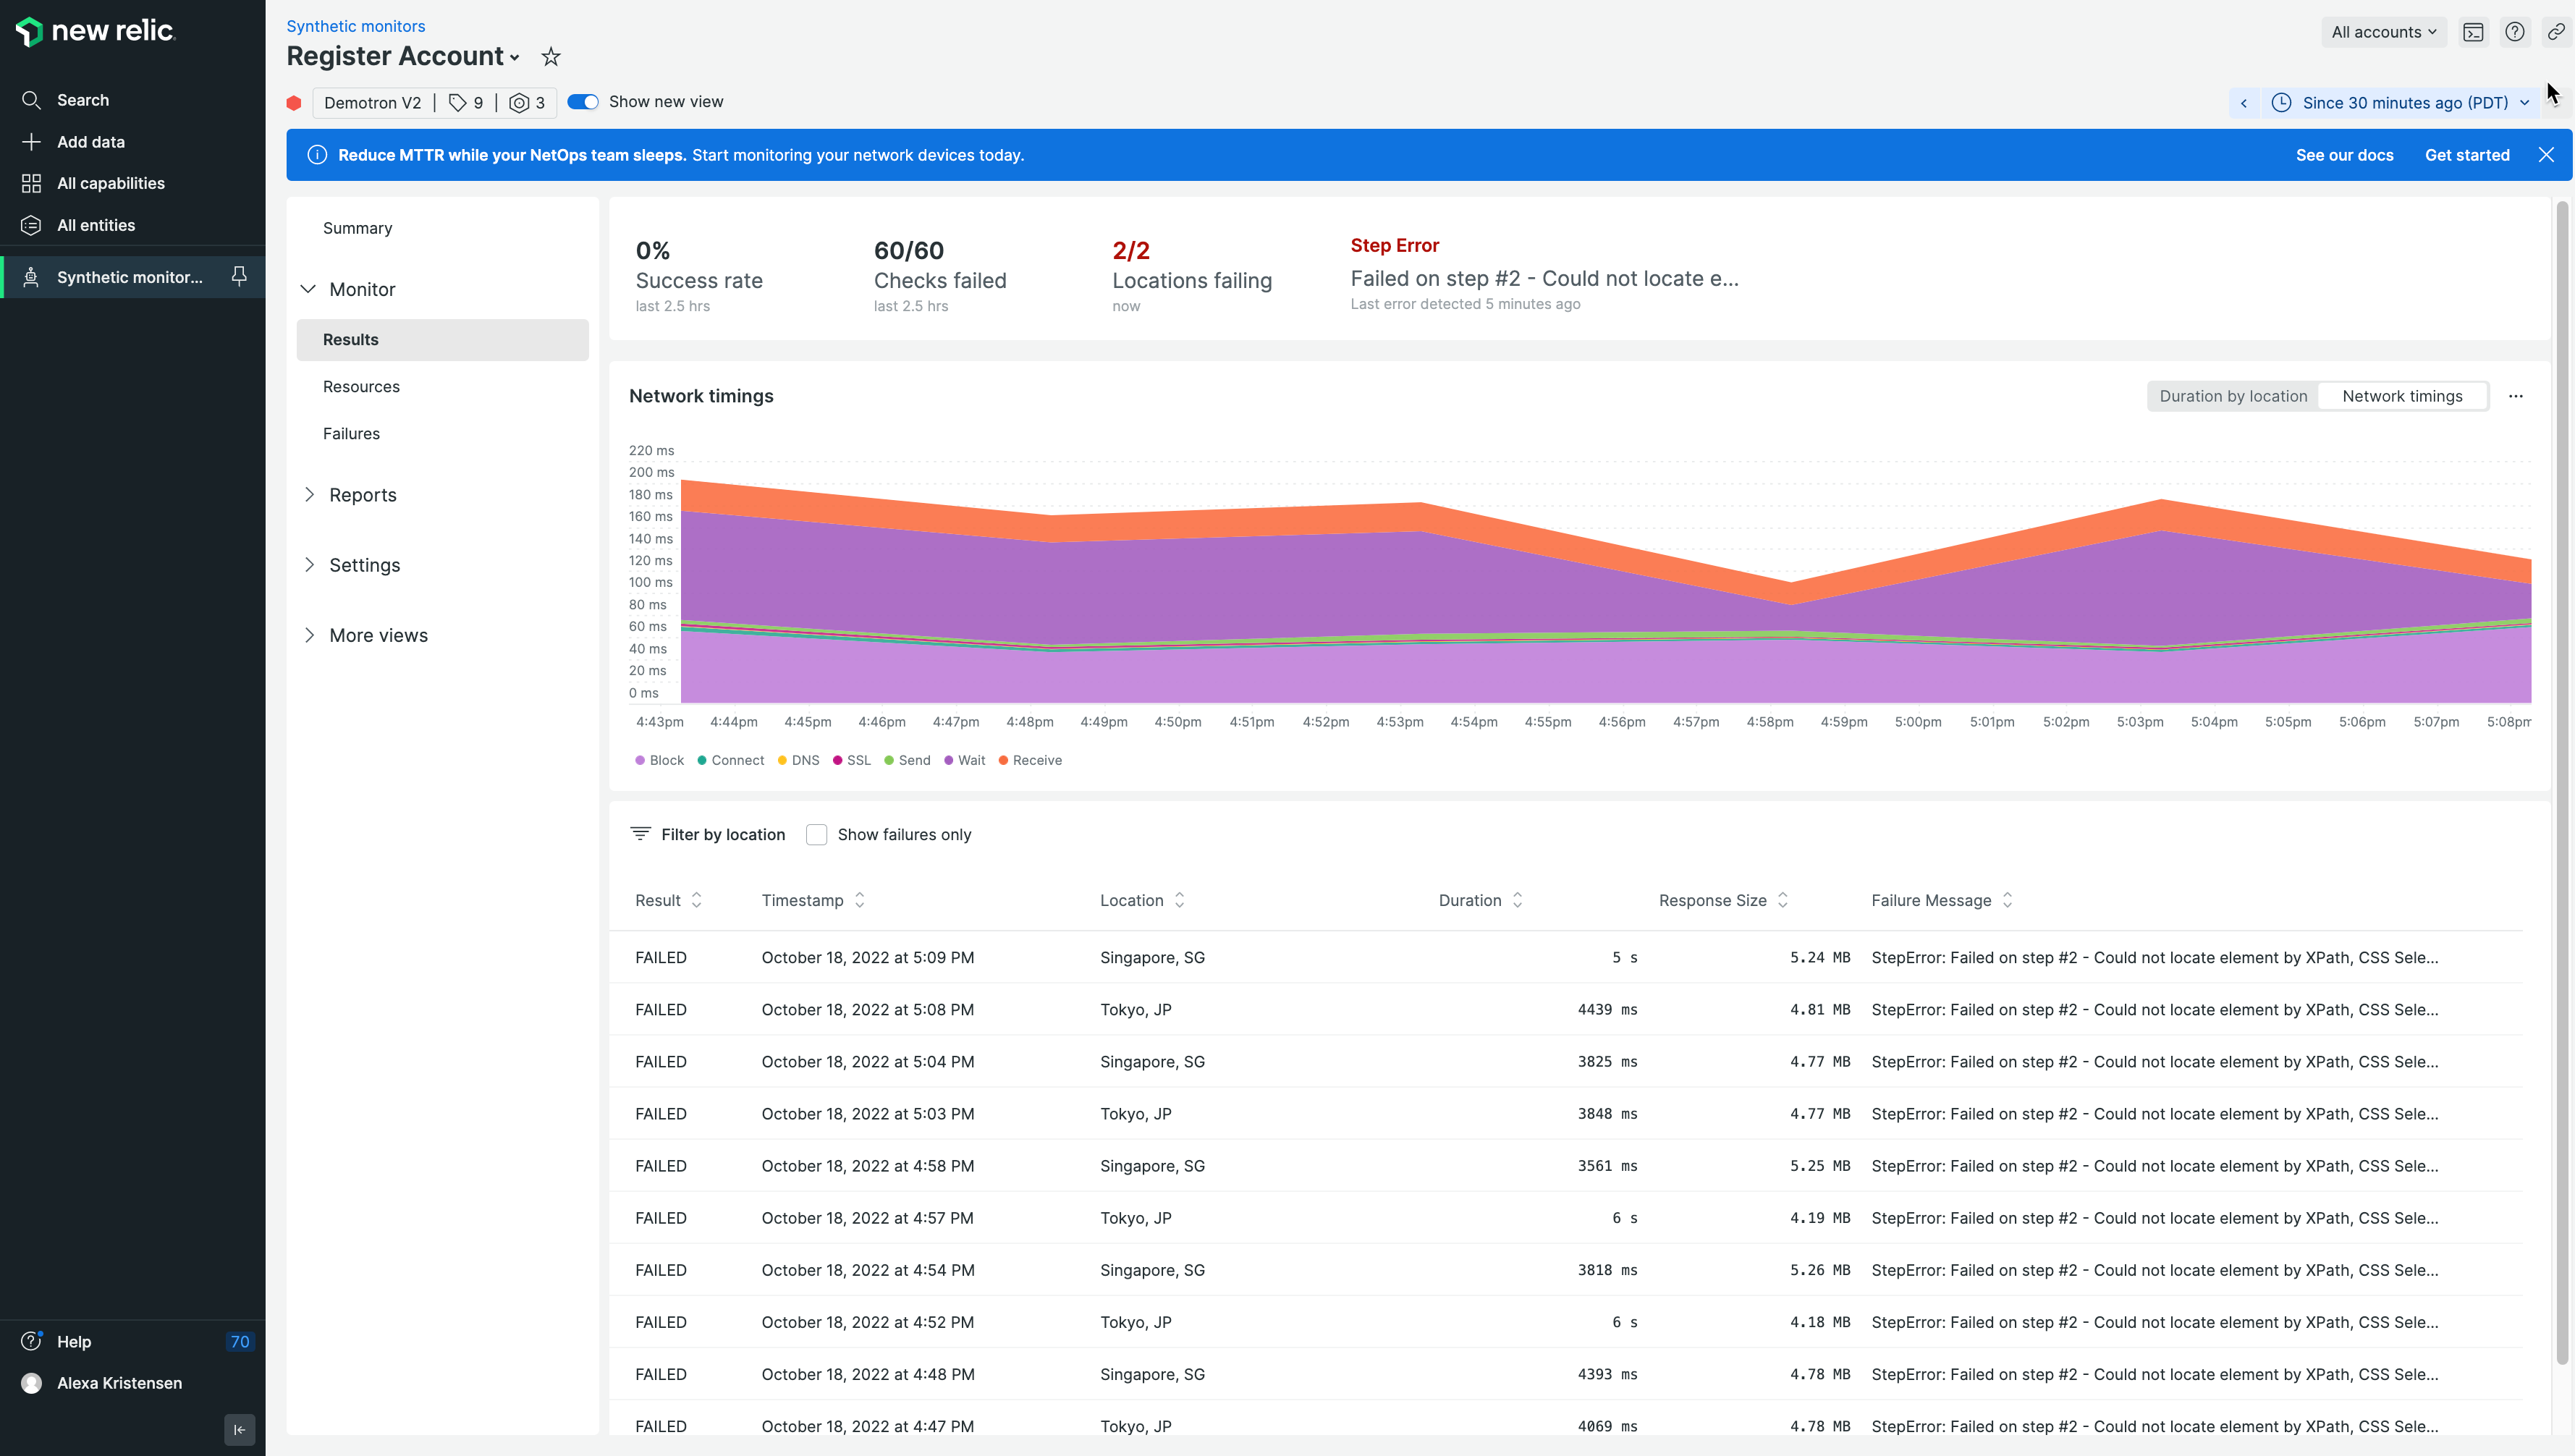
To view the results of your Synthetics Monitor, go to the Synthetics dashboard in New Relic. You will see a list of all your active monitors, along with their current status and performance data. Click on a monitor to view more detailed information, such as response times, error rates, and performance breakdowns.
Setting up Synthetics Monitoring in New Relic is an essential step to ensure your web applications are performing optimally and providing a great user experience. By following the steps outlined in this article, you can easily configure and deploy Synthetics Monitors tailored to your specific needs. With the data collected by these monitors, you will be well-equipped to identify and address performance bottlenecks, improve website uptime, and ultimately deliver a seamless experience for your users.
Remember to regularly review the results of your Synthetics Monitors and make any necessary adjustments to your web applications to maintain peak performance. Additionally, consider exploring other New Relic features, such as Application Performance Monitoring, Infrastructure Monitoring, and Digital Experience Monitoring, to gain a more comprehensive understanding of your application’s overall health and performance.
With Synthetics Monitoring in place, you can have peace of mind knowing that your web applications are consistently delivering the best possible experience to your users.

“Typical beer trailblazer. Hipster-friendly web buff. Certified alcohol fanatic. Internetaholic. Infuriatingly humble zombie lover.”


